Introduction
Video: Introduction to Constraint Detection
Overview
seeq-constraintdetection is an Add-on for control loop performance monitoring which is used for detecting constraints and saturation in control loop signals. A control loop consists of multiple components which are namely the controller, the actuator, the process, and the sensor.
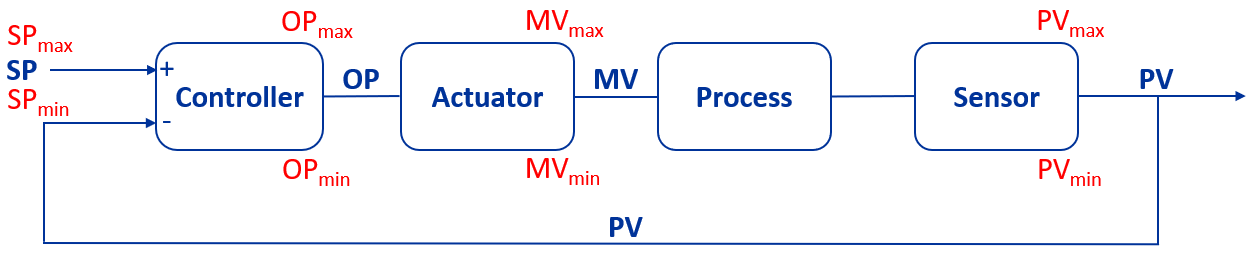
Figure 1: Control loop with constraints
The outputs of these components are the setpoint (SP), the controller output (OP), the process variable (PV) and the manipulated variable (MV). The setpoint, controller output, process variable and manipulated variable can reach constraints due to different underlying reasons. The actuator and the sensor can reach a constraint because of their physical limitations due to the actuator range or the measuring range. The controller output becomes saturated when the actuator reaches a constraint. The setpoint can meet constraints if certain control structures such as constrained model predictive control (MPC) or constrained cascade control are used. When a control signal reaches a constraint, the time trend sticks to the signal minimum or maximum and only deviates from there for short time periods.
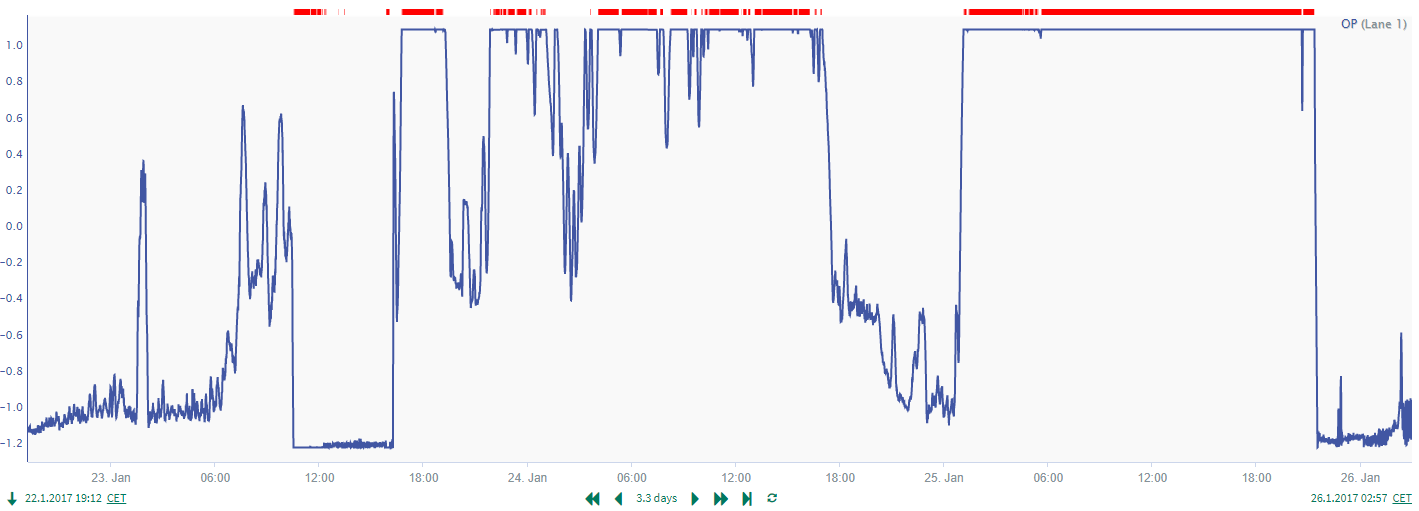
Figure 2: OP signal with saturation
seeq-constraintdetection imports a complete asset tree consisting of control loop data and detects periods where control signals become constrained or saturated. The detection results are visualized in treemap view where the user gets a plant-wide overview of constrained/saturated signals and can drill down to the time trend where periods of constrained operation are shown as time capsules. In addition, the ‘Constrained Time %’ or ‘Saturated Time %’ is calculated as the time-percentage a signal is constrained/saturated in the analysed time period. The Add-on provides an intuitive user interface in which the user can specify which time period and which control signals are of interest for him/her. Furthermore, thresholds can be set for the coloured visualization of the ‘Constrained Time %’ or ‘Saturated Time %’ in the treemap.
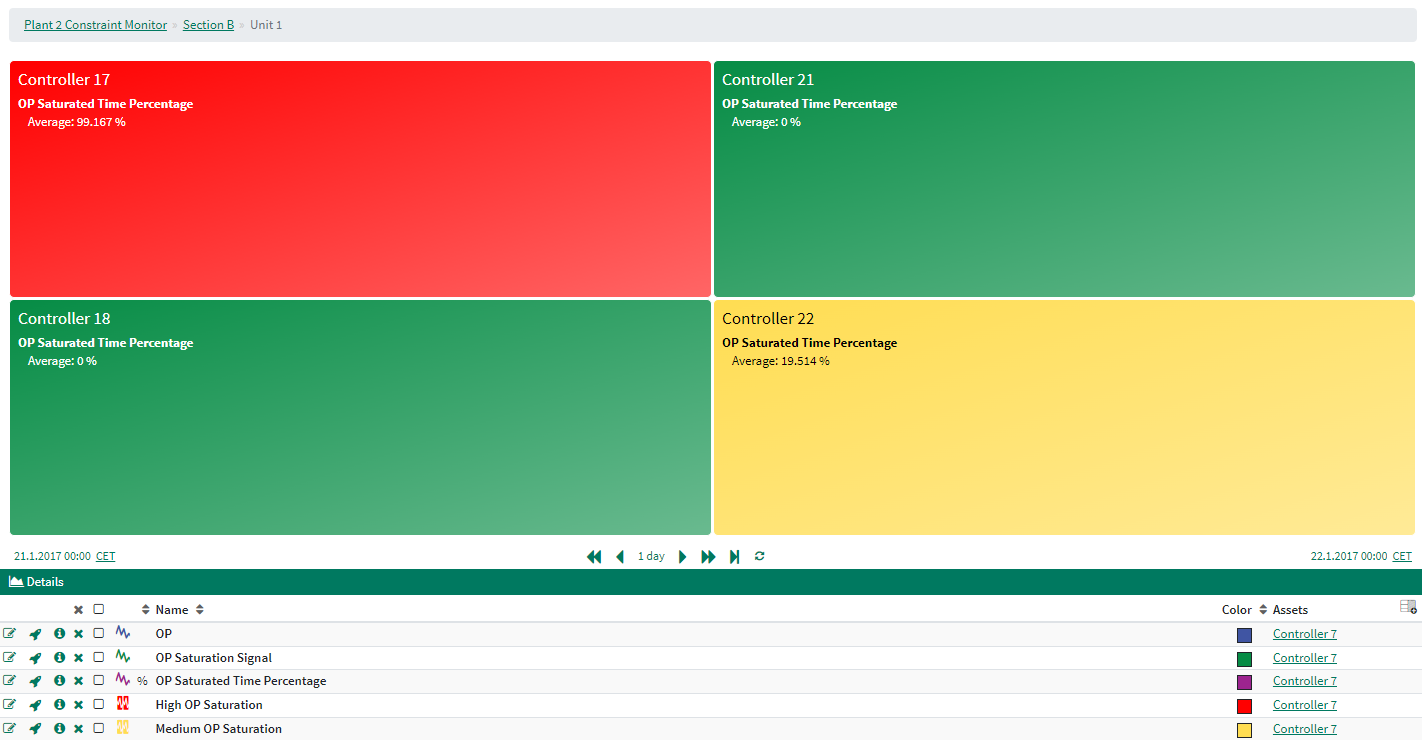
Figure 3: Constraint detection results in treemap view