User Guide
Video: User Guide
Asset Tree for Constraint Detection Add-on
The Constraint Detection Add-on analyses a complete asset structure of control signals. In order for the Add-on to recognize which signals belong to which controller and which signal type is involved, the asset tree must be available in a specific structure. Each control signal must be assigned to a controller and must be named according to its signal type. This is necessary so that the results can be displayed correctly in the treemap. Accepted names for the control signals are only “Controller Output”, “Setpoint”, “Process Variable”, “Manipulated Variable” and “Mode”. No specific naming is required for the higher-level controllers. The controller can be named “Controller 1” or “FIC 1” or completely different.
Template Notebooks
Template code for generating the required asset tree in Seeq Data Lab can be found here.
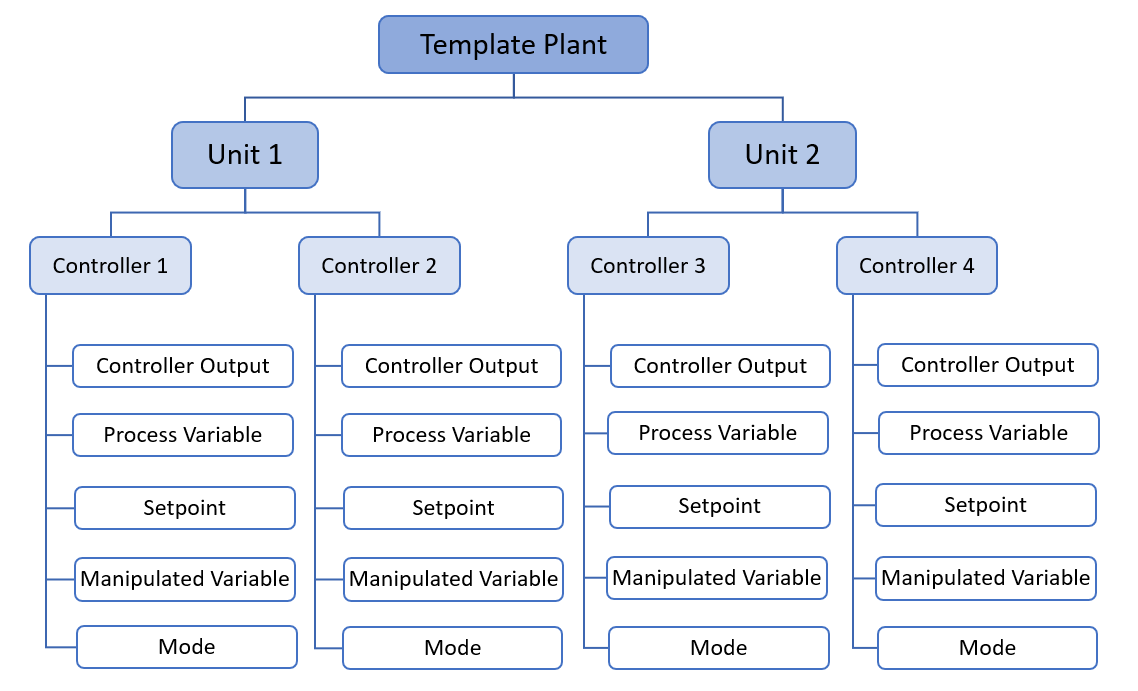
Figure 1: Example for an asset tree in the required structure
Workflow
Open Constraint Detection from Seeq’s Add-on menu in the Tools panel.
Select a start and end time for the analysis. By default, the Add-on will insert the start and end of the display range of the active worksheet.
Select the signal types you want to analyse. For example, if only the controller output signals are to be analysed, only the checkbox for ‘Controller Output’ must be activated. It also possible to execute the analysis for multiple signal types at once.
Select the asset tree you want to analyse.
(Optional) Enter a name for the asset tree copy. The Add-on generates a copy of the selected asset tree in the analysis time interval. After the analysis, the asset tree copy with the specified name will show up in the Data panel in the workbench. If the text field is left empty, the word ‘Constraint Monitor’ will be appended to the asset tree name. For example, if the asset tree name is “Example”, the new asset tree will be named “Example Constraint Monitor”.
Enter threshold values for the treemap visualization.
If the ‘Constrained/Saturated Time %’ lies below the yellow threshold, the corresponding controller will have a green colour in the treemap.
If the ‘Constrained/Saturated Time %’ lies between the yellow and the red threshold, the corresponding controller will have a yellow colour in the treemap.
If the ‘Constrained/Saturated Time %’ lies above the red threshold, the corresponding controller will have a red colour in the treemap.
(Optional) If short capsules or gaps should be ignored during periods where the analysed signal is constrained/saturated, then short capsules and short gaps can be specified in the expansion panel.
Run the analysis by clicking the ‘Execute’ button. A progress bar will appear and the user interface will be disabled while the Add-on is executing the analysis. If your asset tree contains several hundred signals and you want to execute the analysis for a large time interval, then the analysis can take around 15 minutes.
Wait for the user interface to be enabled again. The analysis is now complete. The table will show a Top 30 of the signals with the highest ‘Constrained/Saturated Time %’. The table can be downloaded by clicking the ‘Export table to CSV’ button.
Return to the workbench and refresh the web page. Then move to the worksheet(s) with the name ‘Constraint Detection Treemap’. For every signal checkbox that was activated in step 3, a new worksheet with a treemap was generated. For additional insights, the ‘Constrained Time %’ or ‘Saturated Time %’ can be selected as a statistic.
Explore the treemap and use the table in the user interface as guidance.
(Optional) Short capsules and gaps can still be defined after the first execution by specifying them in the expansion panel and clicking on the ‘Recalculate’ button. This will affect the time capsules in trend view and the calculated ‘Constrained/Saturated Time %’. This step can be executed iteratively.
Close the Add-on window.
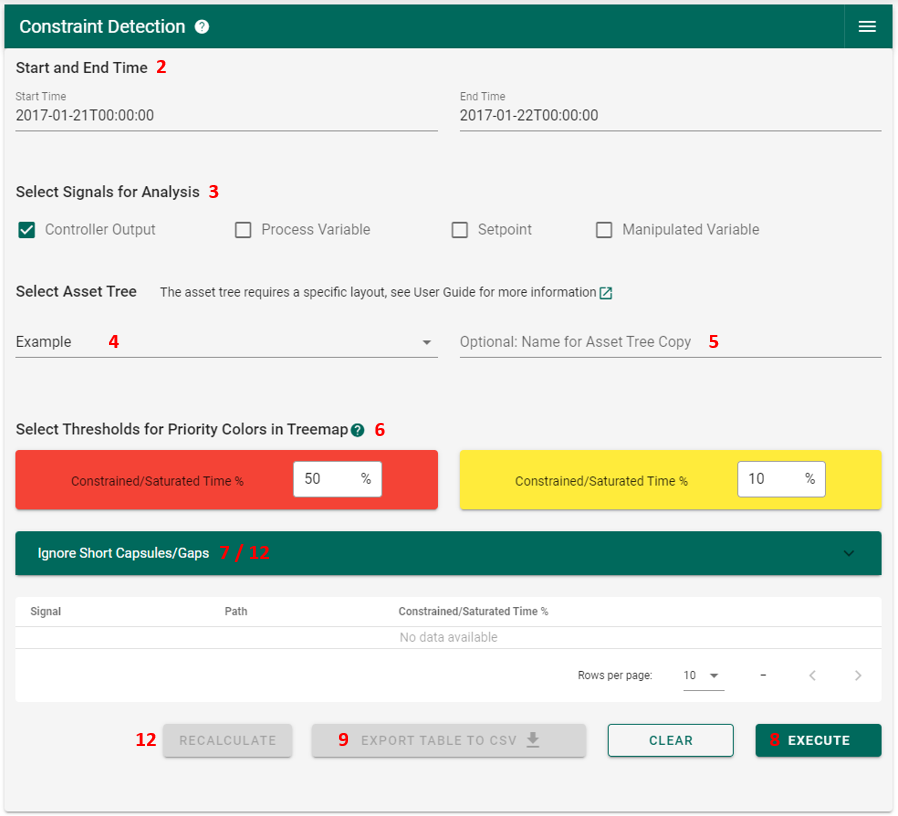
Figure 2: Worflow in the UI
Causes for Constraints and Saturation
Causes for saturated controller output:
Inappropriate actuator dimensioning
External disturbances
The system is operated away from its original design specifications.
Poor controller tuning
Integral wind-up: In modern industrial control systems anti wind-up schemes are implemented to prevent intregal wind-up. Therefore, controller saturation is usually not caused by integral wind-up but by the constraints of the manipulated variable.
Intended way of operation: On-off control and mid-range control are examples where the controller output is deliberately saturated most of the time.
Causes for constrained process variable:
The actual process variable lies outside of the sensor’s measuring range.
The sensor is damaged.
Causes for constrained setpoint:
Constrained MPC is applied.
Cascade control with constraints is applied.
Causes for constrained manipulated variable:
Inappropriate actuator dimensioning
Intended way of operation: For control valves, it is not unusual that a valve should be fully opened or fully closed. In this case, it is intended that the manipulated variable reaches a constraint.